

It seems that no one really wants to read anymore unless it’s an engaging headline or a brief quote. There is a solution and a way to get your message across quickly. Infographics will help you get the attention you want while delivering the facts even if your audience doesn’t want to read. Infographics are a data-centric visual aid – A well-organized piece of content that may include text, images, and charts to convey important insights to the reader. Infographics can be used as a stand-alone content piece or alongside other content like articles, presentations, and even videos. It is by far one of the easiest ways to convey heavy content in a digestible manner.
Why Are Infographics Important?
To stand out in a content-saturated culture, you have to do something different-duh! Due to shorter attention spans, many consumers view online content quickly which means most only pay attention to the first line of any content, and by the time they reach the third line, their interest hangs by a thread. Content creators and writers have to try harder than ever to retain the readers’ attention, either by embedding an infamous cat video or if you think that is too millennial, adding supportive materials like infographics, pictures, and videos within your content.
Infographics have become increasingly popular because they contain visually appealing information that is easy to digest We say, any good article should not be without a complementary set of infographics.
These days, every good content creator must be skilled in making infographics on their own to amplify what they are communicating. Here’s how they do it.
How to Create an Infographic
- Conceptualize
Making an infographic without a concept is like directing a movie without reading the script. It is impossible. Since most infographics are no more than letter size, and typically much smaller, whatever information you want to deliver needs to be concise and compact. Too much information and the infographics may appear wordy, too little information and we might just call it a poster. A key standard practice is to ask the following questions before you start beginning your design process.
- Who are the infographics for?
- Is it standalone or does it accompany other pieces?
- What are the key things that need to be included in the infographics?
- What is the key takeaway for the consumer when they look at the infographics?
2. Gather relevant data
Infographics are data-centric and although your visuals may be data-heavy, it is important to drill down and ask yourself the above questions before crafting the exact information you want to display. Once these questions are answered and a general concept is formed, all the appropriate and impactful data and content you want should be gathered. Easy enough, right?
3. Content is still king or queen!
Without content, you have nothing, just some pretty colors, and fonts.
As always, content is what provides value to your readers. Typically, a copywriter or someone in a marketing role would be the appropriate person to provide you with the content for your infographics. The right person will take the data and turn it into digestible bites for readers to easily consume. Following the simple tips below will help you turn masses of information into concise content.
Add compelling data: Infographics are ideal for highlighting key insights, and powerful data that can educate the reader and keep them engaged. Look for data that could draw the reader in and emphasize it in your written content.
Tell a story: While data can provide an impact, infographics are not a grounds to simply arrange all data arbitrarily. The infographics need to tell a story, an appropriate title that tells readers what they can expect followed by insights and findings that connect as the reader walks through the content from start to finish.
4. The Design
There are many routes you can go to design your infographics. You can use templates provided by online tools like Canva or Piktochart. Or design something from scratch using Adobe. You do not necessarily need to be a designer to make infographics, although a good understanding of fonts and color theory helps.
Something to keep in mind to elevate your infographic designs is to use an appropriate style.
Styling your design: Use available tools like font pairer, and color matcher to ensure the design is complimentary within the infographics and pleasing to the eyes.
Make branding a priority: If your infographics are created for your brand or company, you should be using brand colors and your logo to help maintain uniformity within the content you create and to make your brand noticeable if shared. These are not only good branding practices, but they also remove the hassle of finding multiple colors for every single infographic or other visual content you may create.
5. Proofread: Be detail-oriented. It may appear obvious or even like a small feat, but it is imperative to make sure the design content is properly aligned, there are no typos, it reads like a story, and has a sense of design. Failing to proofread may produce content that does not represent professionalism and could discredit the hard work you have done so far.
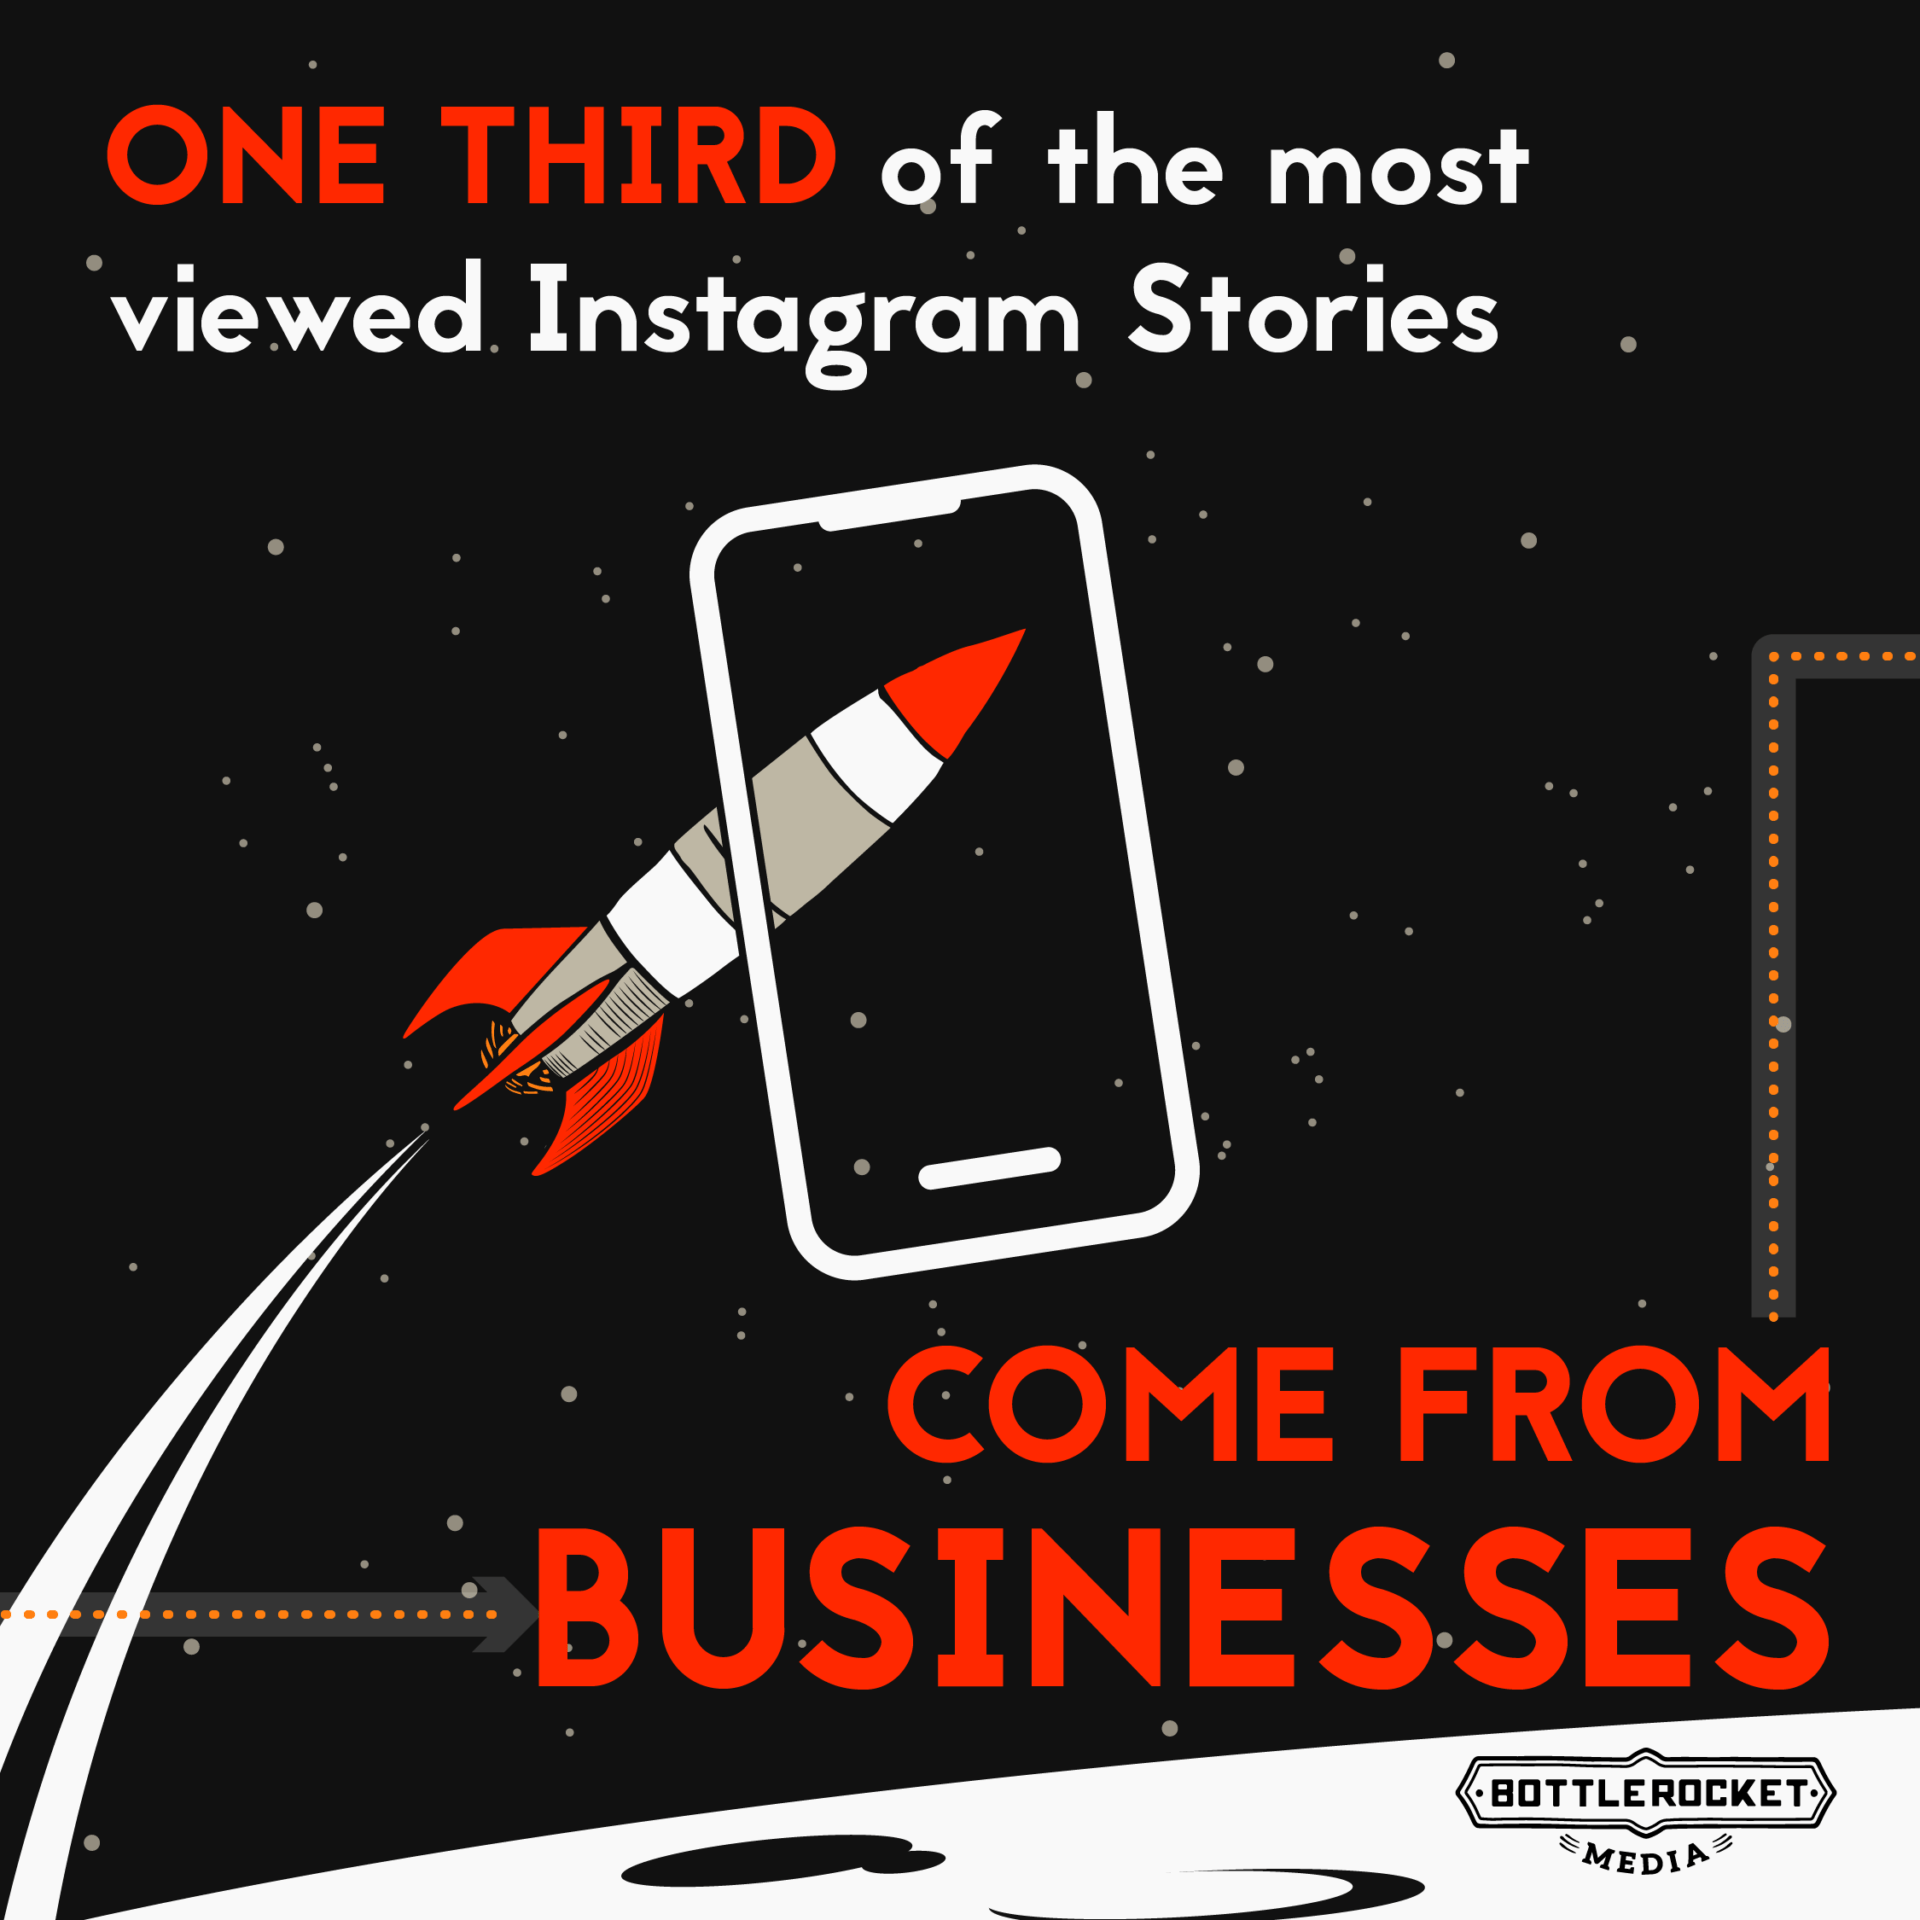
Below is a great example of an infographic that probably has important insights but due to its poor design and storytelling, it fails to make an impression on the reader.
The above infographic is hard to follow without a storyline, the spacing between the text is too tight making the infographics come across as wordy instead of insightful.
6. Some additional quick tips:
Have multiple file formats: As infographics are data-driven it is important to keep them relevant so having JPEG and pdf formats alongside editable formats like PNG is a good practice to ensure any edits in the future can happen without a hassle.
Citing sources at the end of the infographics: Instead of cluttering your design and including URLs of your citation within the design have a simple link at the bottom of the infographics which directs viewers to a web page.
Utilizing the infographic tool is one of the most effective ways to convey information in an easy-to-understand format. Accessible and user-friendly design tools have made creating such content easy and efficient. So, what’s stopping you now from creating your very own infographics?
From concept to delivery we are a creative team that loves design and storytelling through video. We can literally talk about it all day long. To learn more about Bottle Rocket Media’s video production services and other services like motion graphics services, connect with us to start your video project.